Understanding Data and Performance
Key Points
[ ]How do I find out how much time my code is spending in a function?[ ]How do I know if a function is worth optimizing or not?[ ]How do modern CPUs and memory architectures work?[ ]What does IPC stand for and what does it mean?[ ]Is there such a thing as a "good" or "bad" IPC value, and is it the only important performance number?[ ]Is big-O performance the whole story for algorithms? Why or why not?[ ]What is a cache miss and why should I care?[ ]How do I find out how many cache misses and accesses are happening in my code/in a particular function?[ ]How can I tell if my code is CPU-bound, memory-bound, or I/O-bound?[ ]If I suspect cache misses are an issue, how do I avoid them?[ ]What are padding bytes?[ ]What is "memory locality" or "locality of reference" and how can we fix structs with poor locality?
[ ]When are cache misses not a sign of a major problem? In other words, when should I not worry about fixing cache miss issues?[ ]What code are we trying to optimize today?[ ]What is our goal in optimizing today's code?[ ]What is the relationship between the number of objects and the size of the world in terms of our performance tradeoffs?[ ]What is spatial partitioning?- Other Points
- What is the difference between task and data parallelism?
- Why is it hard to construct realistic benchmarks?
The Game Loop Revisited
So far we've oriented our designs around the game loop: the idea that we receive input, simulate the world forward, and display the world in a strict cycle. We might take zero, one, or more simulation steps at once depending on what else is happening with the computer, but ultimately we serialize those three steps—and we treat simulation as a monolithic black box. But when we do that, sometimes we leave performance on the table. Modern computers all have more than one processor core and can do work concurrently, and if we ignore this capability we'll be both slower and less power efficient.
It's definitely worthwhile to separate simulation from rendering. However, there's no reason simulation needs to stop while rendering is happening—if a simulation thread outputs "game states" into a circular buffer, a rendering thread could grab a game state and display it anytime it's ready without pausing the simulation (or even grab two states and draw an interpolation between them). Moreover, we can often do multiple distinct simulation or rendering tasks simultaneously: for example, after we've gathered contacts, we could restitute them while also processing gameplay events based on contacts happening, or we could process AI updates separately (and at a lower frequency) from collision detection; on the rendering side, we could sort dynamic objects into the proper drawing order while drawing the background.
These approaches are called task parallel since they split up work into distinct tasks and run them on different cores. If every process has to take place every simulation step, a fork/join model or semaphores (or other synchronization techniques) can ensure coherence; but we can often relax this assumption if we don't care about deterministic replay and allow for all the tasks to produce data at their own rate, communicating via shared buffers (behind e.g. Mutex or RwLock, of course!) or message-passing channels (like Rust's crossbeam::channel). Tasks can produce work for each other and consume that work, distributing the normal flow of simulation control. This sounds complicated—you must take care around features like saving and loading or pausing—but can make good use of multiple cores.
Another important consideration is task starvation and other forms of scheduling competition: sometimes there just isn't that much work to do for a task, so it will sit idle on a core while another one strains to complete its work on time. If you have tasks with data dependencies between each other, the bottleneck on throughput will be determined by the slowest task. Operating system schedulers can also lead to unpredictable behavior as expensive tasks might be preferentially de-scheduled in favor of short-lived ones, so you must start to consider pinning tasks to cores, changing thread priorities, and other added complexities.
Data parallelism is an alternative to task parallelism. Whenever we have data that can be processed independently of each other, we can use pools of threads (and possibly tricks like Rayon's work stealing queues) to process groups of them independently, maximizing throughput. There are data-parallel opportunities in a variety of game programming tasks: if we have spatially partitioned collision detection we can do contact generation and restitution in parallel for each partition; we can compute animation poses and evolve particle systems in parallel; there are parallel sorting algorithms for z-ordering and other purposes; many culling algorithms can work in parallel; and so on. In Rust, we tend to use the rayon crate and its par_iter and par_iter_mut adapters to get a convenient Iterator-like interface to data-parallel computation. If that's tricky, we consider moving to threads and crossbeam::channel unless lots of data needs to move around, in which case we resort to RwLock or Mutex.
All of these are high-level approaches to parallelism, which we explicitly opt into; each has overheads and at best a linear throughput speedup in the number of threads (though latency improvements can feel higher). But as it turns out, your CPU is already doing a surprising amount of concurrent processing even for single-threaded code.
How Computers Work
Let's develop an intuition for how your computer works. We'll ignore user input for now and think of it as a machine with a big block of RAM, an instruction pointer IP denoting which RAM address contains the next operation to execute, and a processor which reads that IP, performs the operation at that address (possibly reading from and writing to other RAM addresses or the IP in the process), and increments that pointer. Maybe there's a stack, a region of memory that tracks return addresses for function calls, and maybe there's some registers on the CPU that offer fast access to important values. So the computer can instantly read from or write to RAM, instructions of different sorts take different amounts of time, and we can find out which parts of a program are slow by finding out where in the regions of the instruction code IP is spending most of its time.
This model is simple, elegant, and completely inadequate to understanding performance on modern hardware.
First of all, we use multicore processors and multithreading, so we have multiple CPUs and multiple IP pointers and stacks (one per thread). So code running on one CPU might write to a region of RAM currently being read by another CPU. Programming language design won't help us here, because those threads might belong to different programs!
Also, RAM access is not instantaneous. In fact, RAM access isn't even uniform—RAM modules which are physically closer to the processor are accessed faster than modules farther away. Moreover, RAM is not the only kind of memory in computers nowadays. Today, CPUs have their own extremely fast and close on-chip memory called cache, often arranged in a hierarchy: a small amount of very fast L1 cache (on my computer, 512KB), a larger amount of slower L2 cache, and a luxurious amount (16MB!) of slower L3 cache. Sometimes some of these levels (like L3) are even shared across cores. To get a sense of the speeds involved, you might look at a table like this one (taken from the book Systems Performance: Enterprise and the Cloud), which tries to put the latencies onto a human timescale with one cycle mapping to one second. Specific numbers will vary from computer to computer, but on my machine at least these are roughly accurate:
| 1 CPU cycle | 0.3ns | 1s |
| L1 cache read | 0.9ns | 3s |
| L2 cache read | 2.8ns | 9s |
| L3 cache read | 12.9ns | 43s |
| Main memory read | 120ns | 6min |
| Solid-state disk I/O | 50-150μs | 1-12 months |
| Rotational disk I/O | 1-10ms | 4 years |
| … | … | … |
Compared to cache, RAM is slow. Like, really slow.
In any event, now the model needs to change a bit: When a CPU needs a value for an operation or to know the next instruction, it first checks if it's in the cache somewhere; if not, it reads some memory from RAM and loads it into cache before proceeding. It takes some time to get the memory into cache before the instruction starts, so now the same instruction might take different amounts of time depending on whether we need to call out for the data. In fact it's a bit more complicated still, since CPUs and memory controllers can't really read a single byte or small range of bytes at a time and put that into cache; caches are made up of lines of a particular size, usually aligned on some boundary. For example, if I want the memory at address 0x1050, I might need to load all of 0x1000–0x2000 into cache (replacing whatever was in the cache before!). If I only needed one byte there, I'm not really using my limited memory bandwidth and cache capacity effectively.
This points out a surprising fact: data structures like linked lists which achieve constant time insertions and deletions do so by ignoring non-uniform memory access speeds, sweeping them under the rug of "constant factors". While they're bounded by a constant (the worst case RAM retrieval latency), that constant is so high that simpler, seemingly worse data structures can outperform asymptotically better ones! Arrays (or Rust Vecs) are nearly always preferable to linked lists since each list pointer is likely to involve a main memory access which of which only one pointer is actually used—this means the processor spends more time waiting for data than actually doing work! Likewise, arrays of pairs (or array-heaps) can beat hash tables for small numbers of data items, since more of the data is stored in a contiguous block; the cache is used more for each read, and the cache access pattern is predictable. Predictability is key for the sake of pre-loading: if I read the first 4KB of an array, I'll probably read the next 4KB afterwards, and the next 4KB after that, so while I'm working on the each 4KB block the following block will be loaded into cache in anticipation of being useful for future work.
As an aside, this is also why I've pooh-poohed object-oriented programming in this class: if a method call (a virtual function call) requires following an object pointer to figure out what the receiver is, and then following a function pointer to find out what code to execute, I've already blown a lot of time just waiting for data to come back. Also, if I call the same method on a bunch of different objects in a row, I can't even cache the code of the function I'm executing—the processor has no way to predict what will come next or what memory it will need!
Coming back to the multicore setting for a moment, imagine that one thread is about to write during another thread's read. Caching means that this is a bit safer (if CPU1 has started executing the read, it's already cached the old value while CPU2 writes to it), but for as long as that memory location remains in cache, the observed value of that location might be different depending on what core the code is running on! Cache coherency logic in the hardware makes sure that this type of nonsense doesn't happen, but it can be a source of slowdown if multiple threads are all reading from and writing to the same region of memory. The first big lesson of today, then, is that you need to write code differently because not all memory accesses are the same. In this example, rather than, say, accumulating results from multiple threads into one array of values, you might have each thread produce its own array of values and then merge them afterwards. This reduces contention over the memory location.
Surely we now have a useful model of our processor, right?
Right?
…
Modern Processors
So far we've assumed processors do one thing at a time in a cycle: read the PC, fetch operands, execute an instruction, repeat. Even with our model of concurrency, each processor is doing just one thing every "tick". Unfortunately this is completely wrong.
If you've ever done laundry, you know how processors use pipelining to save wallclock time. You start a load of wash; when it's done you move it into the dryer and start the next load in the washer. For as long as you have loads of laundry, you keep both machines humming along. If you did loads one after another you'd see usage like this:
| Time | 0:15 | 0:30 | 0:45 | 1:00 | 1:15 | 1:30 | 1:45 | 2:00 | 2:15 | 2:30 |
| Load 1 | Wash | Wash | Dry | Dry | Dry | |||||
| Load 2 | Wash | Wash | Dry | Dry | Dry |
If we pipeline them it takes half an hour less, since we ran the wash while waiting on the dryer.
| Time | 0:15 | 0:30 | 0:45 | 1:00 | 1:15 | 1:30 | 1:45 | 2:00 |
| Load 1 | Wash | Wash | Dry | Dry | Dry | |||
| Load 2 | Wash | Wash | Dry | Dry | Dry |
Adding a third load won't influence the finish time of loads 1 or 2:
| Time | 0:15 | 0:30 | 0:45 | 1:00 | 1:15 | 1:30 | 1:45 | 2:00 | 2:15 | 2:30 | 2:45 |
| Load 1 | Wash | Wash | Dry | Dry | Dry | ||||||
| Load 2 | Wash | Wash | Dry | Dry | Dry | ||||||
| Load 3 | Wash | Wash | Dry | Dry | Dry |
Since we're waiting on the dryer in the middle of our pipeline, each additional load now adds 45 minutes to the total time, rather than one hour and 15 minutes.
Now see what happens if we add 15 minutes of folding into the mix, so one load takes 1:30 end-to-end:
| Time | 0:15 | 0:30 | 0:45 | 1:00 | 1:15 | 1:30 | 1:45 | 2:00 | 2:15 | 2:30 | 2:45 | 3:00 |
| Load 1 | Wash | Wash | Dry | Dry | Dry | Fold | ||||||
| Load 2 | Wash | Wash | Dry | Dry | Dry | Fold |
If we pipeline them it takes just 45 minutes more than a single load:
| Time | 0:15 | 0:30 | 0:45 | 1:00 | 1:15 | 1:30 | 1:45 | 2:00 | 2:15 |
| Load 1 | Wash | Wash | Dry | Dry | Dry | Fold | |||
| Load 2 | Wash | Wash | Dry | Dry | Dry | Fold |
Adding a third load won't influence the finish time of loads 1 or 2:
| Time | 0:15 | 0:30 | 0:45 | 1:00 | 1:15 | 1:30 | 1:45 | 2:00 | 2:15 | 2:30 | 2:45 | 3:00 |
| Load 1 | Wash | Wash | Dry | Dry | Dry | Fold | ||||||
| Load 2 | Wash | Wash | Dry | Dry | Dry | Fold | ||||||
| Load 3 | Wash | Wash | Dry | Dry | Dry | Fold |
With pipelining we can complete three loads of laundry in the time it takes to do two end-to-end! This is assuming, of course, we have somewhere to put wet clothes while waiting on the dryer.
On a CPU, there are lots of different jobs to be done: Fetching instructions, decoding them, doing arithmetic, writing out results, and more. Just like in our laundry example, we can do some of these steps for one instruction while another instruction is at a different stage in the pipeline. The longer our pipeline, the greater our time savings… as long as everything goes smoothly! The smoothness of our pipeline can be measured with a number called instructions per cycle or IPC: on average, how many operations are in flight during every clock cycle? In our three-load laundry example we have 1 instruction at the first timestep, 1 at the second, 2 at the third, and so on. On average we have 18 instructions divided by 12 cycles, giving LPC (laundry operations per cycle) equal to 1.5. Numbers above 1 indicate effective pipelining; if it's exactly 1, that's serial code; and if it's less than 1, we're spending too much time waiting on RAM or other resources.
Okay, so if everything goes smoothly pipelining is great. But what if, in our laundry example, we ran out of quarters after starting the dryer for our first load? We'd have to go to our car and dig around under the seat or whatever, or in the worst case go back to our home. Then we'd be able to start the wash for load 2—this would not only delay load 2, but also the start time for load 3! We'd very quickly approach that awful serial performance. We call these events where we fail to keep the machinery busy pipeline stalls (or sometimes bubbles), and they are deadly for our IPC metrics.
A stall is bad, but things could be worse. For example, we might take laundry out of the dryer and start folding it, only to discover that it's still a little bit wet! So we throw it back into the dryer and run it again for a little while, delaying not only that load but all subsequent ones waiting on the dryer. The metaphor is honestly getting a bit strained at this point, but we haven't let that stop us yet! On a CPU, we often have branching operations that calculate values or jump to new instructions based on conditional checks. We can't truly know whether we will execute instruction A or instruction B after a branch, but we don't want to stall waiting for the comparison instruction to finish execution. What can we do? We can just start executing A and hope for the best! This keeps the pipeline full and avoids a stall, but if it turns out B was the correct choice we need to cancel the rest of A (and, whoops, any instructions following it), undo any changes it might have made, and then execute B. This might mean flushing the whole pipeline! Modern CPUs have circuitry to predict branches based on past experience, and systems programming languages and their extensions often allow programmers to designate certain branches as likely to be picked. One final note to keep you up at night: sometimes these pipeline bubbles are caused by unexpected things like comparing floats with integers. Read up on your CPU architecture! Well, the world is actually full of horrors: these speculative execution techniques can also cause privacy leaks, leading to security flaws like spectre and meltdown which are, uh, baked into the hardware. Sorry, we just wanted computer to go fast.
Finally, the CPU can decide to execute instructions in your program out of order if it would enable better pipeline utilization. Also, your compiler can just reorder lines of code during compilation if it seems like it might help. So good luck figuring out what your program is actually doing.
Profiling
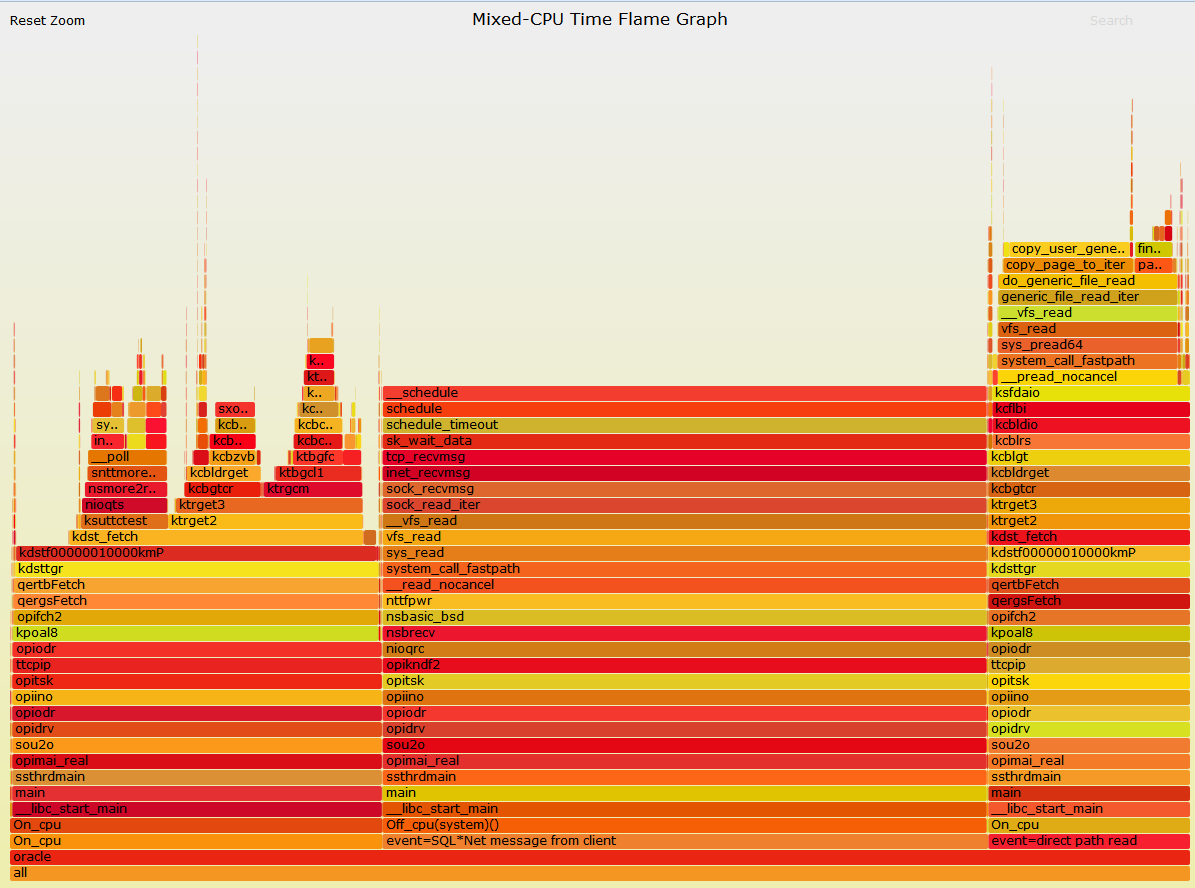
It turns out we don't have to just rely on luck to learn what our programs are up to. Maybe you've used a profiler before in a browser or development environment and you've seen information like this:
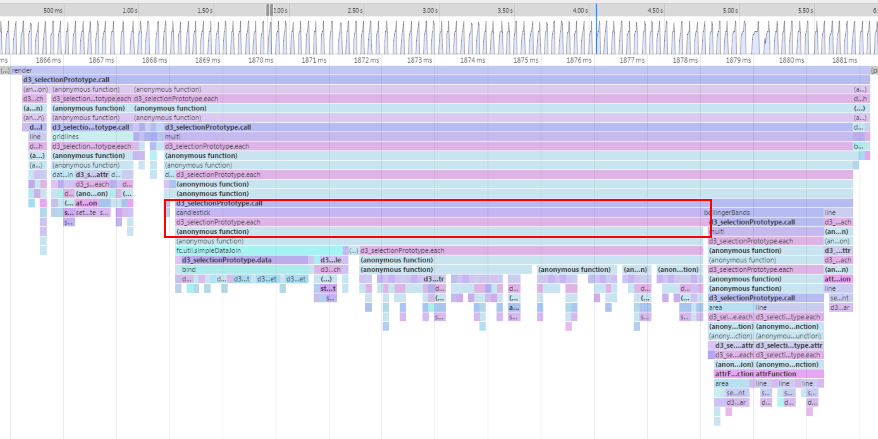
These figures show different user interfaces, but both give similar information. In the first case we have a call tree for a thread, with each line representing a function call and text explaining what percentage of CPU time was spent in this call as well as how many ms in absolute terms (and in this case how many invocations this represents). Call trees might be top-down like this (showing the percentage of time spent in each sub-call of the top-level function) or bottom-up (showing the time spent in every function across all calls, and what percentage of that time came from each caller of the function). This is good for knowing where your "hot spots" are: functions which, if you were to optimize them, would (probably) speed up your program best (see the laundry example though: even if we made the washer twice as fast that wouldn't save us very much time, even though the washer is running for about half of the "program's" life).
In the second figure we have an evocatively named flame graph, which puts either durations of time or, for flame charts, absolute time on the horizontal axis. Each box is a function call, and flame graphs tend to sort and merge the same function call to get more of an overview while flame charts may show the same function being called multiple times through the run of the program. Colors are usually picked randomly, but they could in principle be used to denote something useful.
This is all useful information, right? It's good to know what parts of the program are slow before you try to make the program faster. Unfortunately CPU utilization is only part of the story. In particular, this information just reveals how long and not why: are we seeing pipeline flushes due to branch mispredictions? Memory latency leading to stalls? Waiting on disk reads or, heaven forefend, network packets? Or is the pipeline full the whole time? Cycle counting and clock times give us very little visibility here, and it hurts! If we have two functions using the same block of RAM, whichever one appears earlier in the code will seem "slower" because it has to pay the cost of bringing that RAM into cache. If we gotta go fast, this is not going to get us there unless we're lucky. (The causal profiler coz tries to make some headway on problems like this one.)
Hardware Performance Counters
It turns out we don't have to just rely on luck to learn what our programs are really up to. Modern CPUs have a wealth of accounting information in their hardware called hardware performance counters that can tell us anything from how many instructions have been executed to how many cache accesses (and misses) have happened. Modern operating systems also record information about virtual memory page-faults, multithreading context switches, and I/O events. All that information is there, but how do we get to it?
The answer is somewhat OS- and processor-specific. The most general all-around answer if you're using an Intel chip might be Intel's vTune software, which is free for students as far as I know. AMD has something similar called μProf. These are heavyweight GUI apps that have lots of bells and whistles, and I'll demonstrate vTune briefly in class. On the Mac, there's Instruments and its Counters instrument (quick aside: if you took 151, Instruments uses a forward-chaining logical inference system called CLIPS for its custom instrument definitions). But I'm most familiar with the story on Linux and I like its perf_events tool the best for its compact textual output.
No matter what tool you use, you want to build your program (cargo build --release) and run it through the tool (my_project/target/release/my_project), probably setting its working directory in the process. This varies from tool to tool. perf gives us something like this:
$ cargo build --release && perf stat -e cycles,instructions,cache-references,cache-misses,branches,branch-misses,page-faults,context-switches ./target/release/collision2d headless
    Finished release [optimized + debuginfo] target(s) in 0.04s
GS: 50    Checks: 0
ms per step: 23.066666666666666
cap: 6  cell count: 169744

 Performance counter stats for './target/release/collision2d headless':

     6,794,339,923      cycles
    12,430,285,809      instructions              #    1.83  insn per cycle
       397,612,887      cache-references
        41,115,958      cache-misses              #   10.341 % of all cache refs
     1,968,074,043      branches
        50,252,017      branch-misses             #    2.55% of all branches
             6,830      page-faults
                 2      context-switches

       1.432497887 seconds time elapsed

       1.416351000 seconds user
       0.016003000 seconds sys
Note that I have passed a headless parameter to my program to avoid opening a window and just simulate a certain number of frames as quickly as possible. This is a nice benefit to separating simulation from rendering. perf tells us a lot here: how many cycles and how many instructions (giving us IPC in a comment off to the side), how many cache references and misses (and the proportion of misses to references), branches and branch misses, and other information I asked for with the -e flag. I can dig deeper using perf record (just replacing stat with record in the command line above) and perf report; those two can also take -g arguments to generate call graphs as well that I can navigate like the call tree examples earlier. perf report even lets me see which exact lines of code or assembly explain the cache misses or CPU time costs!
A final note on benchmarking—you want your benchmark code to be representative, but it's hard to craft a really solid benchmark. Moreover, multiple runs are expected to have lots of variation. You could use a tool like criterion instead of the built-in cargo bench or perf stat to get a more robust view of what's going on with your code as you change things.
Performance Intuition
All this information is great, but now we have the opposite problem to what we had before. With so much data it's easy to make up stories—"I need to raise my IPC", "I need to reduce my cache misses", "This explains everything". This is just empirical data and needs to be interpreted in the context of a strong theory including an understanding of your CPU and the behavior of your program.
At the same time, theories without data don't do us much good either. It's definitely true that sometimes struct-of-arrays layouts or separating hot and cold data can improve cache locality in a significant way and speed up the program; it's certainly true that sometimes we should save the result of a computation in a field somewhere to avoid recomputing it; but if the full extent of the theory is a set of rules of thumb, that's just superstition.
There's no shortcut to developing a robust understanding of your own program and the computer it's running on. In the meantime, here are some sets of tradeoffs to keep in mind:
- High IPC is a good sign in that we're not waiting on RAM to do our work. But it's also a bad sign if it means we're doing more work than we need to.
- Smaller objects (and struct-of-arrays) are better since they can fit tightly together, but:
- Padding bytes are often introduced so objects' sizes are multiples of the CPU word size, so sometimes they're not really smaller!
- Turning small data into big data can be expensive, outweighing the benefit of reduced sizes (got to find room for those bigger values somewhere!)
- If we do a bunch of things with the value, that dominates the cost of pulling the value from memory. Saving 50% on 2% of the total time is not very helpful!
- Allocating and freeing a bunch of small things might place them all over RAM, so consider using an arena allocator to keep them together if you're going to iterate on them together.
- Algorithmic improvements (doing less work) matter a lot
- But because of constant factors, sometimes doing more work can be faster!
- Chasing linked pointers is relatively expensive
- Reusing old values can cost more than just recalculating
- More branches can mean more mispredictions
- And you can't pick the right algorithm if you don't understand your data
- Are your lists already mostly sorted?
- Are your data evenly distributed or are they clustered around modes?
- Do they mostly stay the same from moment to moment or do lots of them change?
- But because of constant factors, sometimes doing more work can be faster!
To sum up, some typical advice is to run a profiler to see if you are bound by processing or memory (check IPC), and if memory bound whether it's because of hopefully avoidable cache misses. Depending on the outcome of that investigation you might do different things: If IPC are high, micro-optimizations to code performance might help if there are clear hotspots (perf annotate will help there), or else you might need algorithmic improvements. If memory latency is a factor but cache misses are relatively rare, that also points to the need for algorithmic changes towards algorithms and data layouts that use less memory (like turning an array of big structs into a struct of several arrays; e.g. instead of an array of "entities", a struct containing parallel arrays of positions, sizes, and velocities of each entity). If cache misses are common, you might want to replace algorithms and data structures based on pointers and indirection with flatter, easier to predict structures, or change the way you're iterating through data. Sometimes the up-front cost of copying data into a more convenient representation can save time during processing, and sometimes we just happened to pick the wrong data layout to begin with.
Ultimately there are two things you need to do to learn this stuff: 1. Read a lot about performance engineering and computer architecture, and 2. Profile and optimize a lot of programs. We did the first one already; let's do the second one.