introduction
The goal of this assignment is to familiarize you with data
analysis and visualization. You'll practice handling files in
comma-separated-value (csv) format, create and manipulate Python
dictionaries, and do some basic plotting using
the matplotlib package.
Note that you must not use/import any additional packages.
Additionanlly, this is NOT a pair-programming assignment; everyone will work on and turn in their own files.
part 1
Create a new project named Stocks in the
CSCI51p-Workspace you created on your
Desktop. Double check that you are creating the project in the
right place, or you will likely have trouble finding your files
later. Then download the starter
code and unzip the file (on a Mac, unzipping will happen
automatically). You should see a folder named starter
that contains two files (stock_rain.py
and stock_rain_tester.py) and one subfolder
(csvs) that contains a few csv files. Copy the two python
files and the folder into the (recently
created) CSCI51p-Workspace/Stocks folder. If you
don't see all the new files, ask PyCharm to rescan that folder by
clicking the triangle next to that folder (on the left-side list) to
close and re-open it. The newly added content
(stock_rain.py, stock_rain_tester.py
and csvs) should now be visible.
We will be using the matplotlib library for creating
visualizations. But first we need to install the library as follows:
- Go to the bottom or bottom left of your PyCharm window, and click on
Python Packages, as highlighted in the figure below.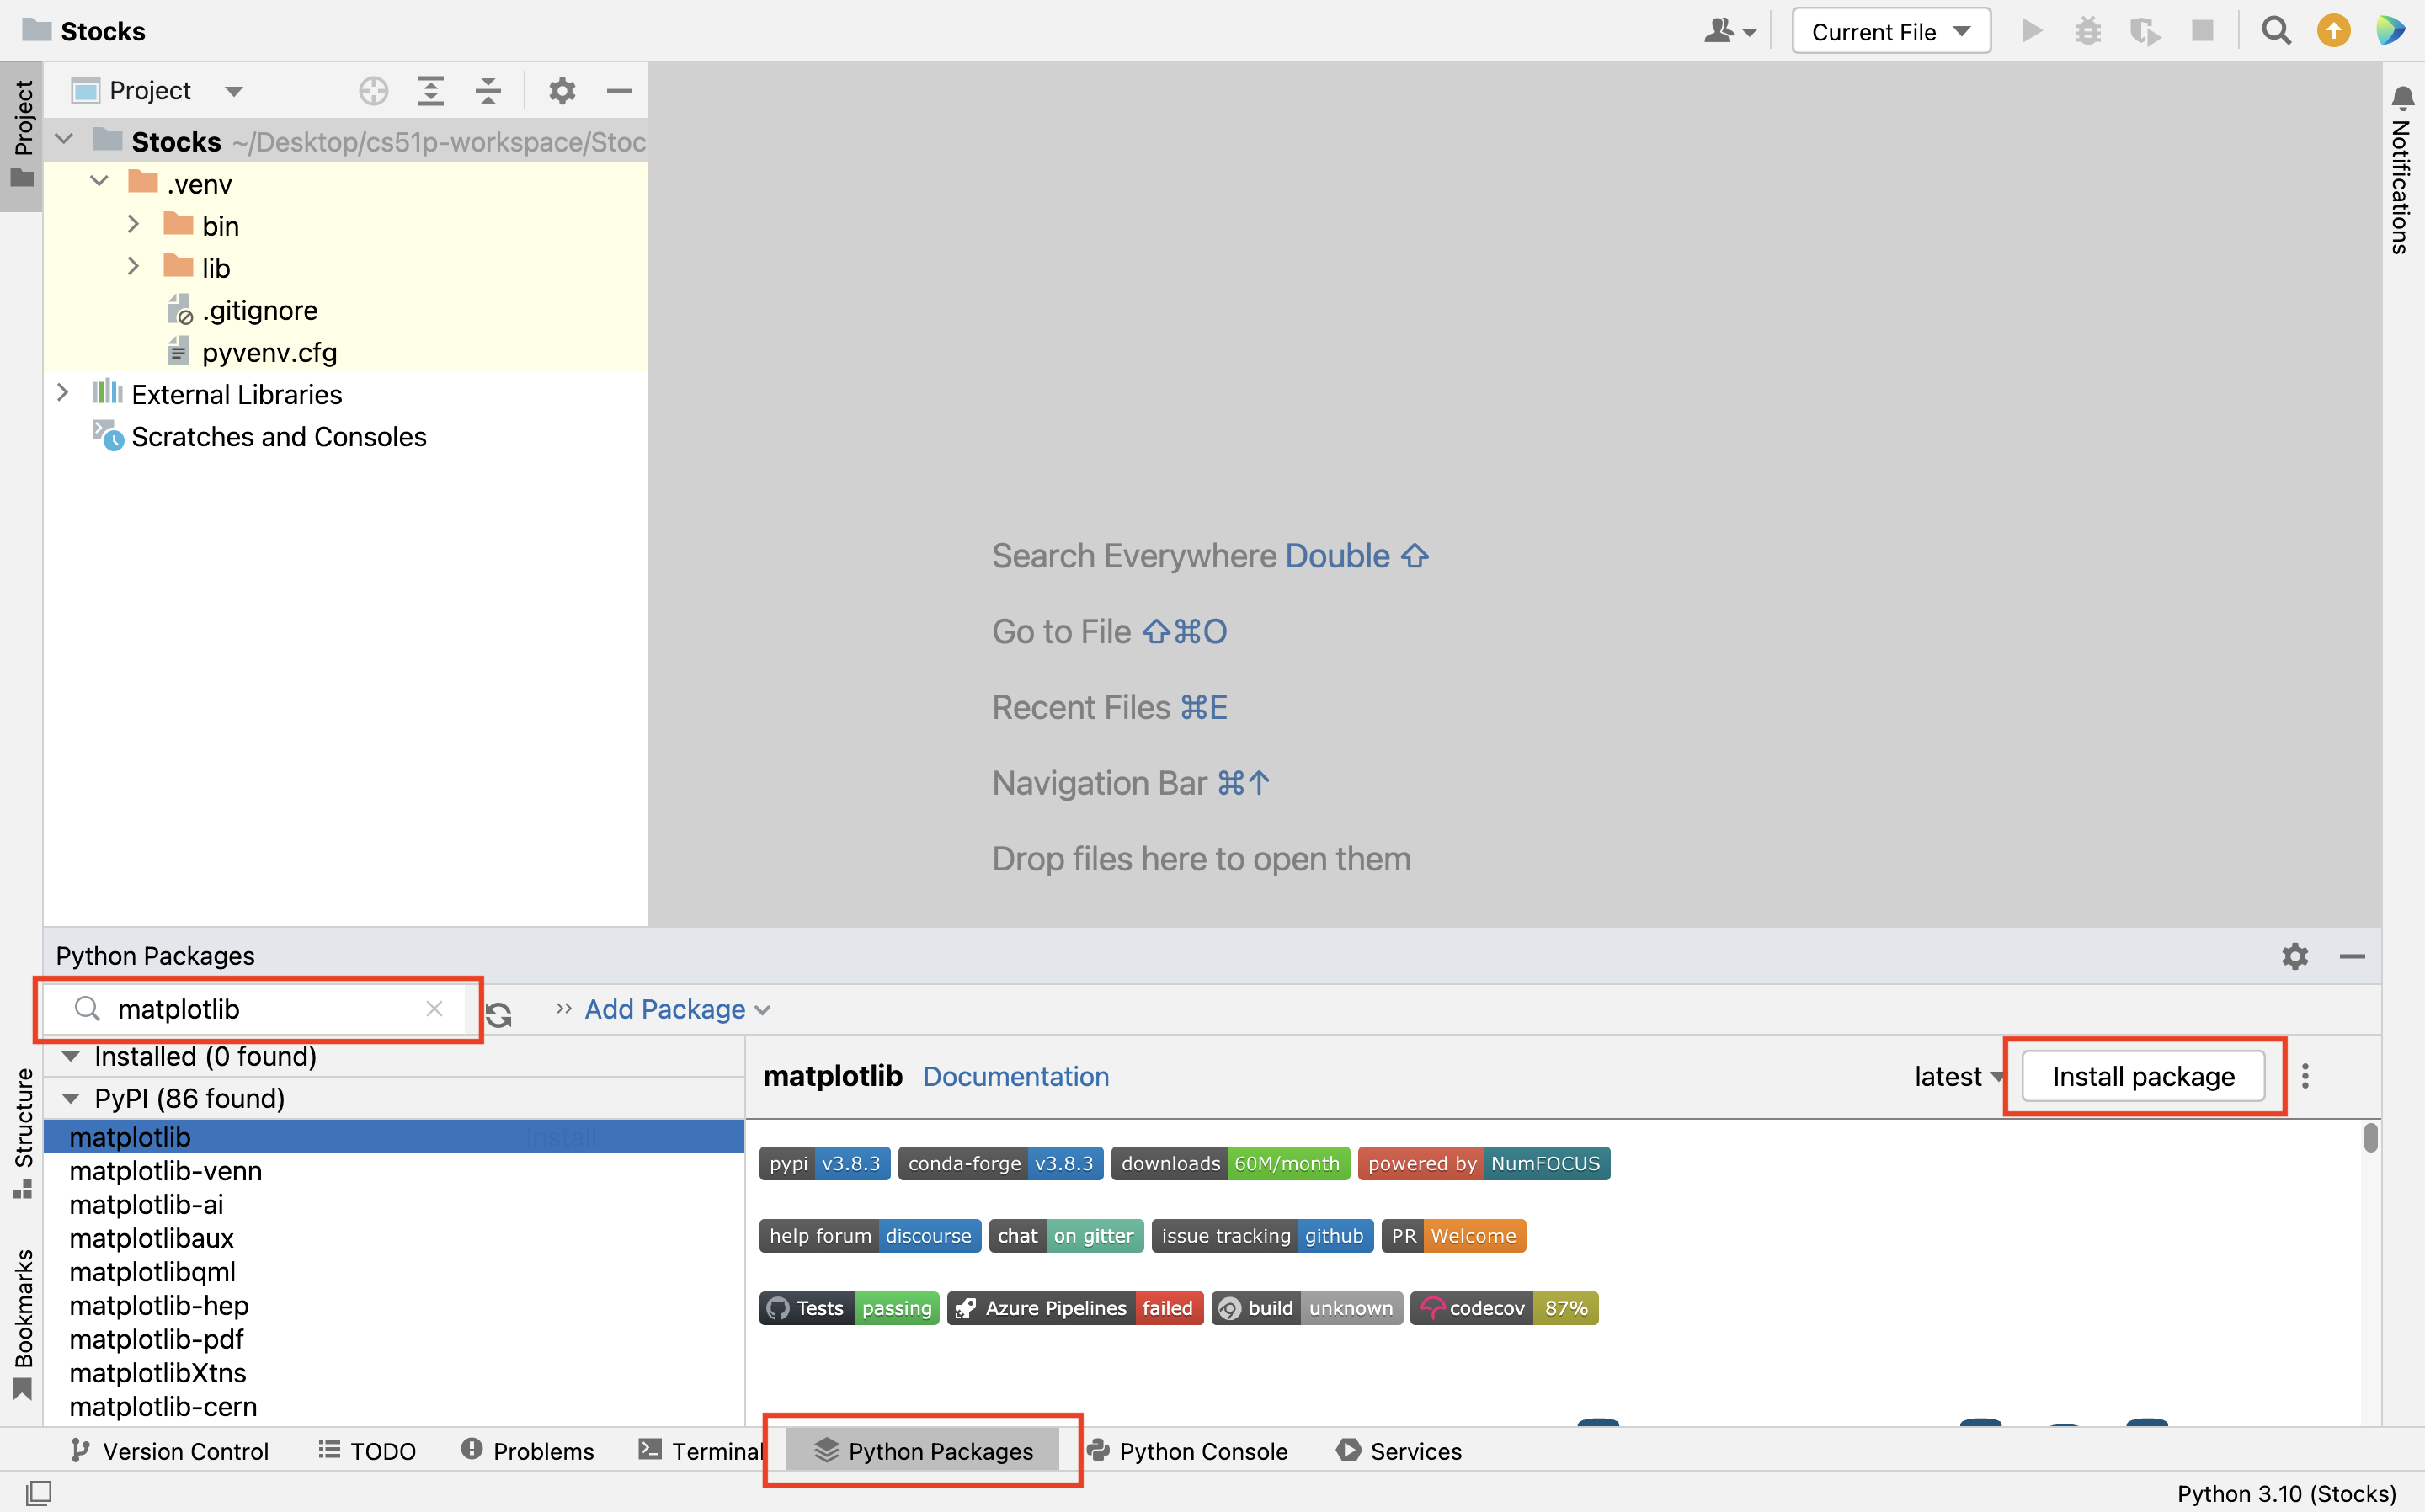
- Then, in the search bar on the left hand side (as highlighted in the figure above), you can type
matplotlibto search for this package. When that option appears in the list, click on it. You should see information about thematplotlibpackage in the sub-screen on the right hand side. - Click on the
Install Packagebutton on the right hand side to installmatplotlib. This might take a few seconds.
After the matplotlib package is successfully installed,
you can click on the Apply button and click
on OK to go back to your project and continue.
Background
There are several published papers that study the hypothesis that weather affects stock prices. One example is Stock Prices and Wall Street Weather by Edward M. Saunders, Jr. A more recent example is Weather-Induced Mood, Institutional Investors, and Stock Returns by William N. Goetzmann, Dasol Kim, Alok Kumar, and Qin Wang. For this assignment, you will use publicly-available stock data and weather data to evaluate whether or not this hypothesis is true.
As a first step, you will need to process the data from the files in your dataset to create Python dictionaries that make it easy to work with the useful parts. To do this you'll write two functions: one for the file with stock price information and one for the file with rainfall information.
Function 1: parse_rainfall(fname)
Part of the provided dataset constitutes weather data for Seattle. The complete
weather dataset is named rainSeattle-1948-2017.csv. There's also a subset of
that data in a file named rainSeattle-2012-2017.csv. And, finally, the file
rainTest.csv is exactly what's shown in the example below.
The files contain a single header line with the names of the columns:
"DATE","PRCP","TMAX","TMIN","RAIN"
This is followed by lines of data in the following format:
    "2012-01-01",0,55,41,"FALSE"
    "2012-01-02",0.43,51,37,"TRUE"
    "2012-01-03",0.03,53,45,"TRUE"
    "2012-01-04",0.8,54,42,"TRUE"
    "2012-01-05",0.05,48,37,"TRUE"
    "2012-01-06",0.1,40,36,"TRUE"
    "2012-01-07",0,45,37,"FALSE"
    "2012-01-08",0,50,37,"FALSE"
    "2012-01-09",0.17,49,41,"TRUE"
The first column is the date. The second is the amount of precipitation in inches, the third and fourth are the high and low temperatures of that day respectively, and the last column is TRUE if and only if it rained that day.
If there's no data for a particular day, that entry will contain "NA" (including the quotes!). For example, the following line is in the weather data:
"1998-06-02","NA",72,52,"NA"
Write a function parse_rainfall that takes one parameter. The parameter
fname is a string that is the name of the file.
The function parse_rainfall returns a dictionary. The keys of the dictionary
are strings that represent dates, such as "2012-01-01". The values in the
dictionary are floats that represent the total precipitation recorded for that
date in Seattle. It will look something like this:
    {
        '2012-01-01': 0
	'2012-01-02': 0.43
	'2012-01-03': 0.03
	'2012-01-04': 0.8
	'2012-01-05': 0.05
	'2012-01-06': 0.1
	'2012-01-07': 0
	'2012-01-08': 0
	'2012-01-09': 0.17
    }
If no precipitation data is available for a particular date, don't create an entry.
Function 2: parse_stock(fname, sym)
We've put three sample files in the usual place for our starters. The complete
dataset is named stocks-2006-2017.csv and contains approximately 100,000
lines of text. The file GOOGL-2012-2017.csv contains just the stock
information for Google from January 2012 through December 2017. The file
stockTest.csv is the first few lines of the Google data and is exactly what's
shown in the example below.
The files contain a single header line with the names of the columns:
Date,Open,High,Low,Close,Volume,Name
This is followed by lines of data in the following format:
    1/3/12,326.8,334.41,326.51,333.04,3677850,GOOGL
    1/4/12,332.85,335.46,330.64,334.47,2864365,GOOGL
    1/5/12,331.4,332.32,328.44,329.83,3283277,GOOGL
    1/6/12,329.9,330.33,325.22,325.34,1438122,GOOGL
    1/9/12,323.57,323.82,310.93,311.54,5825720,GOOGL
The first column is the date and the last column is the stock symbol for the company that this line of data is for. The second column is the opening price of the stock, and third is the highest price it reached during that day, the fourth is the lowest price it reached during that day, the fifth is the closing price, and the sixth is the volume traded.
If there's no data for some reason, that entry will be blank. For example, the following line is in the full stock file:
7/31/17,,201.66,,201.17,1833625,MMM
Write a function parse_stock that takes two
parameters. The first fname is a string that is the name
of a file with stock information in the format specified above. The
second sym is a string that is a stock symbol.
The function parse_stock returns a dictionary. The keys of the dictionary are
strings that represent dates, such as "2018-03-31". The values in the
dictionary are floats that represent the day's change in price, defined as
Close minus Open. It will look like this:
    {
        '2012-01-03': 6.24,
	'2012-01-04': 1.62,
	'2012-01-05': -1.57,
	'2012-01-06': -4.56,
	'2012-01-09': -12.03
     }
Each row from the input file is stored in the dictionary if and only if its
symbol matches the value given as sym. It follows that if sym is a symbol not
present in the input data, the return value is an empty dictionary.
If no stock open, close data is available for a particular date, don't create an entry in the dictionary.
Hint:You may need to write a helper function that translates dates from the format in the stock input files to the format expected for the keys in the dictionary you're creating (e.g., YYYY-MM-DD).
Checking in
When you complete Part 1, check in with a TA to collect your lab points!
Before finding a TA or professor, make sure your process function has
- appropriate docstrings
- good algorithm comments
- mnemonic variable names
- good use of horizontal and vertical white space
We will double check your code, ask you a few questions about it, answer any questions you have, and award your points for Part 1.
This must be completed before leaving the lab. After that you are strongly encouraged to start working on Part 2!
part 2
To perform data analysis and visualization, you will write three functions.
Function 3: correlate_data(stock_dict, rain_dict)
First, you will write a function that combines two dictionaries (created by processing the input files using your functions from Part 1) into a single list containing precisely the data you want to plot.
The correlate_data function takes 2 parameters. The
first stock_dict is a dictionary mapping date strings to
floats representing daily changes in stock prices. The second
rain_dict is a dictionary mapping date strings to floats
representing rainfall daily totals.
Coincidentally (or not), these are exactly the types of dictionaries created by the two functions described in Part I.
The correlate_data function returns a list. Each
item in the list is a list of size 2, which represents
a [stock_price_change, rainfall] pair. Note that
although we used dates as dictionary keys, and although we will
need to use the dates to find corresponding stock/rain pairs,
the list that is returned does not contain any dates. Helpful
hint: Take care that your output list contains only pairs that
were created from dates that exist in both input
dictionaries. If your stock_dict
and rain_dict dictionaries appeared as in the
examples above, then the output of correlate_data should be
the following list of lists:
    [
        [ 6.24, 0.03 ],
		[ 1.62, 0.8 ],
		[ -1.57, 0.05 ],
		[ -4.56, 0.1 ],
		[ -12.03, 0.17 ]
	]
Function 4: scatter_plot(data, format, name, done)
The next task is to create a scatter plot that compares rainfall and price deltas.
The scatter_plot function takes 4 parameters. The
first data is a list where each entry is a list of size
2. The second format is a matplotlib format string. The
third name is a string that represents the stock whose
data is being passed in. And the fourth done is a boolean that is
True if and only if this is the last plot.
When scatter_plot runs successfully, it plots the data in
data. In particular, the function should plot the
hypothesized cause (rain) on x-axis and the hypothesized effect (stock
price change) on y-axis. However, it will only display the plot (and
the legend) if done is True.
Hint: The purpose of the done parameter is to determine when to call plt.legend()
and plt.show(), since nothing can happen after that. Also note that the format of the
data parameter is the same as the return type of correlate_data.
Function 5: main()
Finally, you must include a main() function. First, the main()
function will ask the user to input a rainfall data file, a stock data
file and two stock symbols. Then, the main() function calls
parse_stock and parse_rainfall before also calling
correlate_data and scatter_plot. Since the
motivating question for this assignment involved technology companies
headquartered in Seattle vs. elsewhere, there must be exactly two
stocks plotted by your main function. The first should be either
Microsoft (MSFT) or Amazon (AMZN), since they are both primarily
located in Seattle. The other should be another technology company
that is primarily located elsewhere.
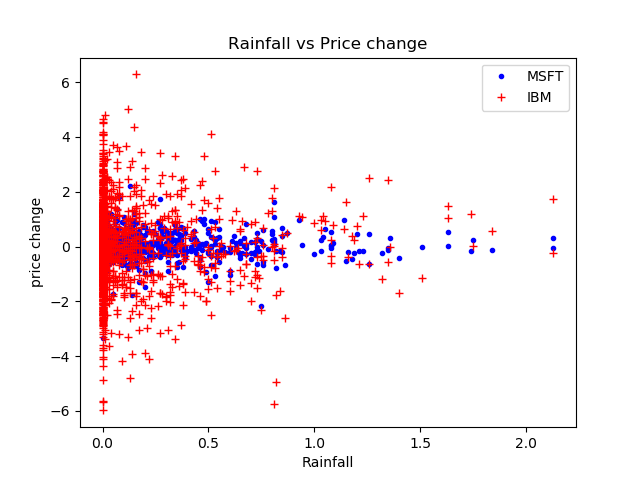
Sample session:
Enter the name of a rainfall data file:
	csvs/rainSeattle-2012-2017.csv

Enter the name of a stock data file:
	csvs/stocks-2006-2017.csv

Enter a first stock symbol (e.g. MSFT or AMZN):
	MSFT

Enter a second stock symbol (not head-quartered in Seattle):
	IBM
After which the program displays a plot like ...
Details, Hints, and Suggestions
- Incremental development and testing will be helpful. The strategy from lab is to start by writing the function headers and docstrings for each function and then writing and testing them one at a time.
- Individual functions can (should) also be developed incrementally. For example, if you're working on the `parse_rainfall` function, make sure your code correctly opens the file and that it correctly identifies the two pieces of information on each line that are of interest. Then make sure it correctly creates dictionary entries for the case where there's no missing data. Finally make sure it works for the case where some data is missing.
- You can open a CSV file in Microsoft Excel, Google Sheets, or any text editor to examine its contents.
- Please make sure the following block is included in your final submission.
    if __name__ == "__main__":
        main()
Testing
We suggest you first use stockTest.csv
and rainTest.csv to test the basic functionality of the
functions you developed. More importantly, you need to use the other
large csv files (in the starter) to test your program, as these files
will include all the possible format of data or corner cases that your
program should consider. Note that the autograder on Gradescope
provide many test cases for parse_stock
and parse_rainfall. You should make sure that your
program pass all of them, so that your main can handle all possible
format of data or corner cases.
We will be testing your code using an autograder, which means you
really, really, really need your function names, parameters, and
outputs to match the specifications given above. You can use
the stock_rain_tester.py file in the starter as a simple
check (that said, our actual tests for grading will be different and
more extensive . . . so please do additional testing of your code as
well!).
Coding style
Make sure that your program is properly commented:
- You should have comments at the very beginning of the file stating your name, course, assignment number and the date.
- Each function should have an appropriate docstring, describing:
- the purpose of the function
- the types and meanings of each parameter
- the type and meaning of the return value(s)
- Include other comments as necessary to make your code clear
In addition, make sure that you've used good style. This includes:
- Following naming conventions, e.g. all variables and functions should be lowercase.
- Using good (mnemonic) variable names.
- Proper use of whitespace, including indenting and use of blank lines to separate chunks of code that belong together.
For more detailed descriptions, please review the Python Coding Style Guidelines.
Ethical Reflection
Now that self-driving cars are close to commercialization, let's consider the ethics of self-driving car crashes. One advantage of autonomous driving is the ability to cut down on fatal motor vehicle crashes. However, even with autonomous vehicles, accidents will happen. Here are some moral dilemmas:
- Should self-driving cars act with predetermined decisions over random decisions during emergency situations?
- Who should decide on how self-driving cars react in certain situations?
- Should the car alsways make a decision that causes the least impact?
- What metric to use when determining least impact?
- Who is at fault when something happens? driver? car manufacturer?
Sources for info include Autonomous Accidents: The Ethics of Self-Driving Car Crashes by Teagan Ampe and 5 Moral Dilemmas That Self-Driving Cars Face Today by Naveen Joshi.
Feedback
Provide a file namedfeedback.txt that answers the usual questions:
- How long did you spend on this assignment? Please include time spent during lab, including time spent on Part 1.
- Any comments or feedback? Things you found interesting? Things you found challenging? Things you found boring?
logistics
Submission
For this lab you are required to submit three files:
-
stock_rain.pya python file that contains the implementation of all the required functions as specified. -
ethics.txtyour short ethical reflection -
feedback.txta text file containing your feedback for this assignment
Note that we reserve the right to give you no more than half credit if your files are named incorrectly and/or your function headers do not match the specifications (including names, parameter order, etc). Please double check this before submitting!
Grade Point Allocations
| Part | Feature | Value |
|---|---|---|
| Lab | Check-in of Part 1 | 3 |
| Execution | parse_stock |
5 |
| Execution | parse_rainfall |
5 |
| Execution | correlate_data |
10 |
| Execution | scatter_plot |
10 |
| Execution | main |
2 |
| Style | Correct file submission | 1 |
| Style | Docstrings accurate, relevant, appropriate | 3 |
| Style | Other comments accurate, relevant and appropriate | 2 |
| Style | Good use of conditionals and loops | 2 |
| Style | Other good programming style (e.g. variables, whitespace) | 2 |
| Style | Misc | 1 |
| Ethics | Completed ethical reflection | 2 |
| Feedback | Completed feedback file submitted | 2 |